Having used Django (and other python web frameworks) on and off for three years, I came across the Play framework some time ago. However, it’s only recently that I’ve been able to use it for for a project. Note that this post is written from a Django developer’s perspective, but I’m not attempting a “Django vs Play” type of comparison. Instead, the following notes how a Django developer might approach the framework and map their own experience to it.
Play looks great for a number of reasons: it’s simple to set up, has a wide range of libraries and plugins that come out of the box, and has an active community surrounding it.
Initial Project Setup
Project setup is simple, and generates the necessary files and directory structure.
1
play new [app]
Replaces the familiar startproject command.
A range of libraries are already packaged with Play, including Joda Time, google-gson, Log4j, test runners, and database connectors. “Convention over configuration” is often cited as one of Play’s aims.
IDE Support
Creating an Eclipse project configuration for your project happens through the eclipsify command. Pydev, on the other hand, requires some manual setup, particularly if you are using different interpreters with vitualenv. Though simple, this can become tedious. And of course, static analysis capability is likely to differ signficantly because of the different type systems, but that’s a discussion outside the scope of this article.
Although this is not directly related to IDE support, it’s also worth mentioning that both frameworks support automatic application reloading based on file changes.
Model Declaration
Play exposes its own JPA (Java Persistence API) interface. The entity manager is already configured and can be easily accessed (e.g. for transactions).
123456789
import javax.persistence.Entity;
import play.db.jpa.Model;

@Entity
public class TestEntity extends Model {

    public String title;
    public Integer count;
}
As you can see, model declaration is concise, though the OO Architect in you might be shouting about encapsulation. Models are accessed directly through model.attribute, but getters and setters are automatically generated and used for access. These can be easily overridden. As a python developer, you might already be missing descriptors and the @property annotation!
A pre-configured entity manager is provided, but can easily be adjusted. In fact, my first application used an exisiting database, so I needed to declare models but disable DDL generation. This was easily done in application.conf.
Templating
Generally, Play’s templating engine can be described as similar to Django’s.
One nice feature is the %{ }% (script) tag that allows you to write scripts (with variable assignment, etc.) Of course, you don’t want to be doing any heavy lifting in the templates, but it can be very useful, e.g.:
Java object extensions (methods added to an object when used in a template) are another useful feature. To take the example from the documentation, the format method applied to Java.lang.Number gives the formatted result:
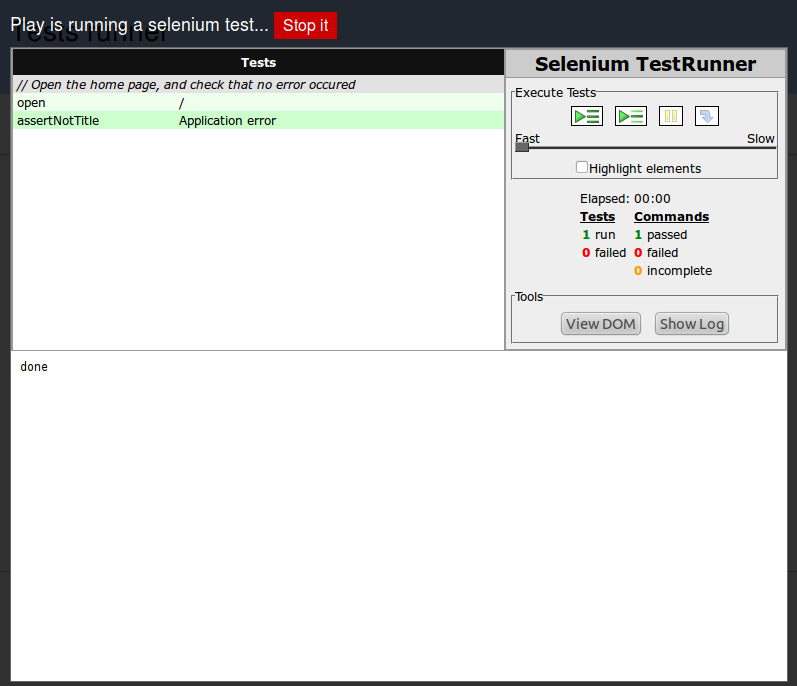
Both Django and Play feature excellent test framework integration. Play has integrated the selenium test framework, and also allows tests to be run from the browser, a very handy feature.
Selenium support will ship in Django 1.4, but is not currently available.
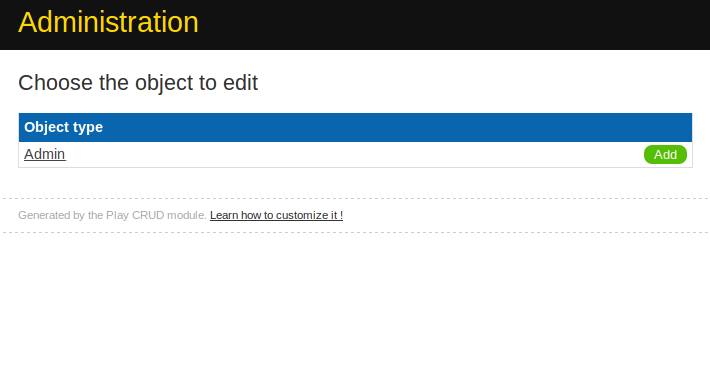
Admin Interface
A great help in Django development is the admin interface. While it requires a little more setup, the CRUD module in Play gives a simple browser-based way of managing entities.
Both frameworks have many strengths, and it is encouraging to see highly active development in both. There are a few features in Play which might make a Django developer envious, such as modules for OAuth/OAuth2 authentication and websockets built in. However, the frameworks are certainly very evenly matched.
Database performance is a crucial factor in web application performance, and can mean the difference between a responsive web application and a slow one. Here, we summarise methods for identifying database performance issues, and how to approach fixing them.
Benchmarking Overall Performance
First, it is worth establishing whether database queries are a performance bottleneck, or whether you should be focusing your efforts on something else. There are a number of ways to do this, and two that I’ve found simple and effective are django-snippetscream and django-debug-toolbar.
Install django-snippetscream:
1
pip install django-snippetscream
and add the following middleware class to settings.py:
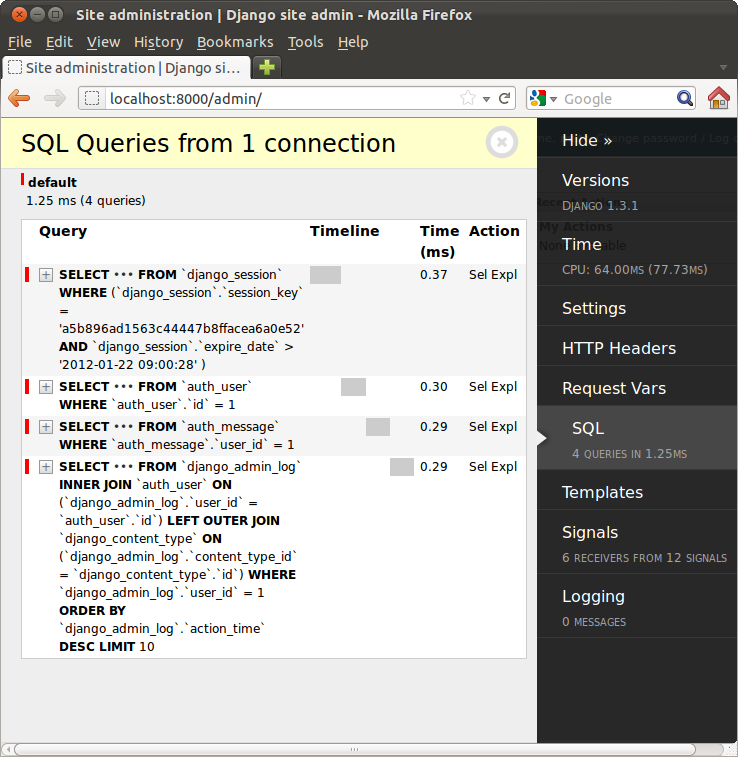
Now, you can simply append ?prof to your application URLs to profile the code run to generate the page. This gives a quick way of telling whether any particular methods are consuming disproportionate resources. Sample output is shown below.
Now, when you visit your site in a browser, the SQL query view will display queries that have been executed and the time taken.
So, you can now judge for yourself whether your application is slow executing queries or if there is some other performance bottleneck. To deal with database issues, read on.
A closer look at SQL query generation in Django
Now that you have a couple of tools by which to measure performance, let’s look at some examples of optimising database performance. We’ll use the following simple models for our discussion.
For each article, there will be a separate query to retrieve details about the user. We can avoid this by using select_related, which tells Django’s ORM to select related models in the same query:
Here, we see that the article’s owner is retrieved using the JOIN clause. So in this example, use of select_related has halved the number of queries executed.
One thing that should be remembered about select_related is that it does not work for many-to-many fields. In our example, that means that article tags would not be fetched in a single query. For these model attributes, there is a new method included in Django 1.4 called prefetch_related. Django 1.4 is currently an alpha release, download it here.
Let’s look at how prefetch_related reduces the number of queries with our example classes. First, observe what happens if we access article tags without prefetching:
As we can see, all tags are fetched in a singlee query using an IN statement. So, select_related and prefetch_related are two effective ways of reducing the number of queries needed for accessing models.
Other techniques for reducing generated queries
If you find that your models are too complex to benefit from the above methods, you can always start writing your own SQL. Of course, this comes with the usual disclaimers: your code may be less portable between databases, and may be harder to maintain.
One method of doing this is to use the extra() method on a queryset like so:
This can be useful if you need, for example, a nested SELECT clause. The other option is to use raw queries, which are documented here.
One last point worth mentioning is to be careful with the use of iterator(), which loads only a subset of a query set into memory. If you then iterate over this queryset, this can generate lots of queries. Here’s a longer discussion.
Conclusion
Hopefully this post has provided a useful discussion of query generation in Django and how you can optimise database access in your application.
Important disclaimer: enabling remote debugging of applications is a potential security risk. The following method should only be used in a development environment, and on a network you control. Use at your own risk.
Most django application issues can be successfully debugged using a local runserver instance on your development machine. But there are times when it is advantageous to be able to debug your application in an environment that more closely resembles production.
For instance, I recently encountered a caching issue that was caused by an incorrect Cache-Control header. The fault was at the application level, and it was useful to be able to trace the request/response behaviour in the full context of the web stack.
This post discusses debugging django, but the same technique can be used to debug any mod_wsgi application.
Environments and Remote Debugging
On my development machine, a set of VMs replicates the web stack. This includes load balancer, web cache, application server, and database machine. runserver is used to test the application locally, then I use fabric to push code to the local VMs.
To debug code when it is running on the server, you can use Aptana’s Pydev plugin for Eclipse. This allows you to run a debug session on your local machine which listens for connections. With the correct setup on your application server, you can step through your application as if it were running locally.
Setup
First, the pydev debugger needs to be accessible to your application. You could use a shared filesystem for this, or you could clone the github repository (though in theory this might introduce compatibility issues). Whichever method you choose, the pydevd module needs to be added to $PYTHONPATH, which is done in your wsgi file. See the django documentation on deployment with wsgi if you haven’t yet created this.
123
importsys# append location of pydev module to $PYTHONPATHsys.path.append('srv/site/plugins/org.python.pydev.debug_2.2.4.2011110216/pysrc/')
After that, invoking the pydevd debugger is simple:
12
importpydevdpydevd.settrace(IP_ADDRESS)
Where IP_ADDRESS is the IP address of machine where you are running Eclipse. You can omit this if you are running both Eclipse and Apache on the same host.
Ensuring Eclipse has Access to Application Code
The last thing to do is to ensure that the debugger can display the source code it is stepping through. This is done by modifying pydevd_file_utils.py on your server like so:
The first element of the tuple is the path to the source code on the host where Eclipse is running. The second element gives the location on the application server. If you don’t do this, Eclipse will prompt you for the location of the source files when the debug session starts.
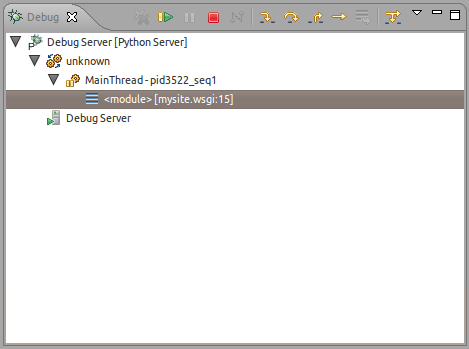
Once your Eclipse debug session is listening for connections, make sure you have reloaded your application:
1
service apache2 reload
Now, just visit the site in your browser. You should see the pydev debugger receive the connection and spring into action.
Conclusion
Remote debugging is relatively simple to set up, and can be extremely useful for debugging certain issues.
To organise the code changes shown above, it might be helpful to create a remote-debug branch containing the necessary changes to your wsgi file. Since you won’t be developing on this branch, merging master periodically should incur minimal overhead.
While writing a module to handle Google ClientLogin recently, I wanted to test error handling by simulating error responses from the server. A simple but powerful way of doing this is to use the patching ability of the mock module.
The patching ability allows you to replace objects in scope with mocks so that different side effects or return values can be defined. Note that ‘object’ is used here in the pythonic sense – referring to entities such as modules and functions as well as class instances.
This is best illustrated by a real example, so in this post we’re going to mock the requests module and generate the exceptions described in the documentation when a request is made.
Our example module sends credentials to Google’s ClientLogin service in order to receive an authentication token, required for accessing certain Google services (such as C2DM). If you are interested, you can read more about ClientLogin on the Google Code page.
So, to request an authentication token from the ClientLogin service, you POST a set of parameters including email and password to the service endpoint. Here is a cut-down version of the code that initiates the authentication request:
1234567891011121314151617181920212223242526
classAuthenticator(object):@staticmethoddefgenerate_token(email,password,source,account_type='GOOGLE',service='ac2dm'):"""Returns an auth token for the supplied service."""base_url='https://www.google.com/accounts/ClientLogin'headers={'content-type':'application/x-www-form-urlencoded',}payload={'Email':email,'Passwd':password,'source':source,'accountType':account_type,'service':service,}try:response=requests.post(base_url,data=payload,headers=headers)except(RequestException):raise
If the requests.post method throws an exception, we simply raise it to the caller rather than handling it immediately. In the requests module, RequestException is the base class from which others (like ConnectionError) inherit. We could improve our approach to exception handling but it is sufficient for this example.
These exceptions will be thrown from our mocked class, which is patched into the above code using a context manager:
Here, we have patched the post method in the requests module to throw a ConnectionError. You can think of this like code injection, where with acts as the closure.
In the real test method, we assert the exception was raised with another context manager:
Here, we assert that the ConnectionError exception is raised to the caller, but we could easily have asserted a different condition. We could, for instance, have verified some exception handling logic.
As we’ve seen, mocking objects and methods in this manner is a simple but powerful way of running your code under different simulated conditions, allowing thorough testing of error-handling logic.
You can see the full module including tests and usage instructions at the github repository. For more information on the mock module, the full documentation is available.
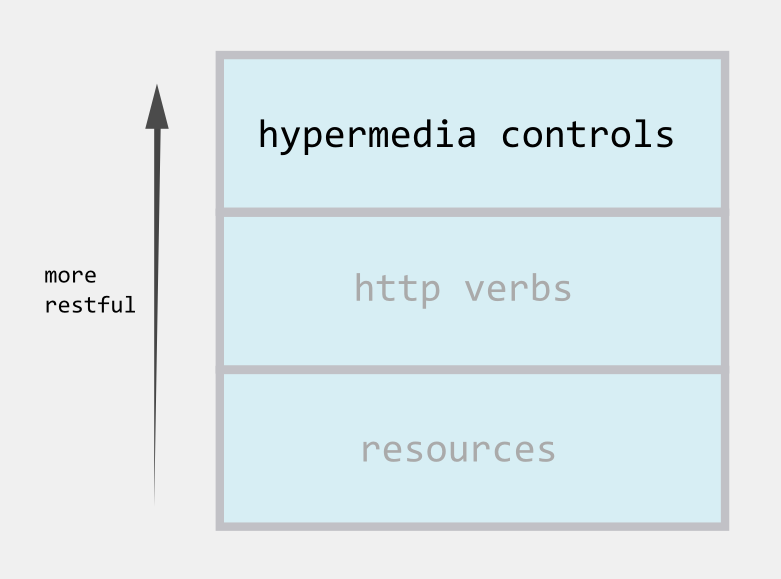
This article roughly follows on from my previous post on REST, which discusses some points relating to the first two levels of the Richardson Maturity Model. Since we’re only going to discuss the top level of the model in this post (shown below), the other levels are greyed out.
Introducing Hypermedia Controls
Hypermedia as the Engine of Application State (HATEOAS) is an element of the REST architectural style, which describes how a consumer can control a given web application using hypermedia controls.
Let’s cut straight to the chase: what do we mean by hypermedia controls?
When I say hypertext, I mean the simultaneous presentation of information and controls such that the information becomes the affordance through which the user (or automaton) obtains choices and selects actions… Hypertext does not need to be HTML on a browser. Machines can follow links when they understand the data format and relationship types. –Roy Fielding
This explanation, from Roy Fielding’s widely cited blog post REST APIs must be Hypertext driven mentions the “simultaneous presentation of information and controls”. To simplify, we can imagine a hyperlink that our consumer is able to understand and manipulate.
So that’s the first word of HATEOAS. What does “Engine of Application State” mean? Quite literally, it means that the hyperlinks mentioned above can be used to control (drive) the web application. If you haven’t already drawn a state machine for your application, now’s the time!
Take, for instance, a RESTful webservice that allows virtual machines to be controlled. The Sun Cloud API is one example of such a service – the examples below are based loosely on the format it uses. If a given virtual machine is stopped, it be may started. Or, if a machine is already running, it may be stopped.
Example request for a machine representation:
123
GET /machines/1/
Host: example.com
Accept: application/xml
Note the link tag. This is a hypermedia control which tells the consumer how it could start the VM by POSTing to machines/{id}?op=start. (For simplicity I’ve omitted necessary details such as Content-Length and xml schema declaration.)
If the requested VM is running, the response would be:
When our VM is running, the resource at machines/1/ contains a rel link to stop it. Both methods would probably return 201 Accepted in the case of success, as it is unlikely they would run synchronously.
In a nutshell, this is the concept of HATEOAS – these hypermedia resources allow us to control application state.
Note that the operation type in the query parameter could also have been a separate resource (such as machines/1/stop). There are arguments for either approach but it isn’t necessary to delve into this to understand the concept of HATEOAS.
Why Hypermedia Controls are Important
In the example above, the representation of a resource also gives us a way to manipulate the resource. In this way, HATEOAS allows certain aspects of the application to be self-describing, fostering loose coupling between service and consumer. If we consider that a service may evolve over time, then this loose coupling could allow the client to evolve with fewer issues than if all controls were hard-coded.
A useful resource that covers this in more detail is Wayne Lee’s presentation Why HATEOAS. Craig McClanahan also discusses the benefits of HATEOAS for service discovery and integration.
This post has necessarily glossed over many details of how HATEOAS is implemented, but has hopefully served as a useful introduction to the notion. I recommend REST in Practice as a resource for going into the subject in more detail. Additionally, the RESTful Services Cookbook contains details on implementation.