Important disclaimer: enabling remote debugging of applications is a potential security risk. The following method should only be used in a development environment, and on a network you control. Use at your own risk.
Most django application issues can be successfully debugged using a local runserver instance on your development
machine. But there are times when it is advantageous to be able to debug your application in an environment
that more closely resembles production.
For instance, I recently encountered a caching issue that was caused by an incorrect Cache-Control header. The fault was
at the application level, and it was useful to be able to trace the request/response behaviour in the full context
of the web stack.
This post discusses debugging django, but the same technique can be used to debug any mod_wsgi application.
Environments and Remote Debugging
On my development machine, a set of VMs replicates the web stack. This includes load balancer,
web cache, application server, and database machine. runserver is used to test the application locally, then I use fabric to push code to the local VMs.
To debug code when it is running on the server, you can use Aptana’s Pydev plugin for Eclipse. This allows you to run a debug session on your local machine which listens for connections. With the correct setup on your application server, you can step through your application as if it were running locally.
Setup
First, the pydev debugger needs to be accessible to your application. You could use a shared filesystem for this, or you could
clone the github repository (though in theory this might introduce compatibility issues). Whichever method you choose, the
pydevd module needs to be added to $PYTHONPATH, which is done in your wsgi file.
See the django documentation on deployment with wsgi if you haven’t yet created this.
1 2 3 | |
After that, invoking the pydevd debugger is simple:
1 2 | |
Where IP_ADDRESS is the IP address of machine where you are running Eclipse. You can omit this if you are running
both Eclipse and Apache on the same host.
Ensuring Eclipse has Access to Application Code
The last thing to do is to ensure that the debugger can display the source code it is stepping through. This is done by modifying pydevd_file_utils.py on your server like so:
1
| |
The first element of the tuple is the path to the source code on the host where Eclipse is running. The second element gives the location on the application server. If you don’t do this, Eclipse will prompt you for the location of the source files when the debug session starts.
Once your Eclipse debug session is listening for connections, make sure you have reloaded your application:
1
| |
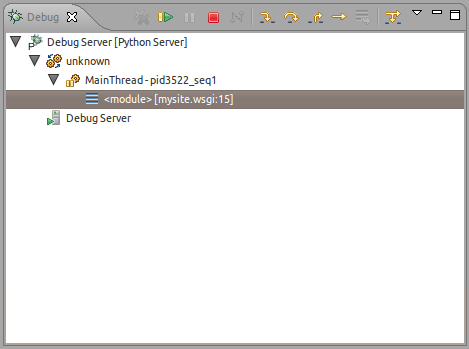
Now, just visit the site in your browser. You should see the pydev debugger receive the connection and spring into action.
Conclusion
Remote debugging is relatively simple to set up, and can be extremely useful for debugging certain issues.
To organise the code changes shown above, it might be helpful to create a remote-debug branch containing the necessary changes to your wsgi file. Since you won’t be developing on this branch, merging master periodically should incur minimal overhead.
There are a host of other debugging methods for mod_wsgi, including interactive command-line debugger and a browser-based shell. These are described in the mod_wsgi documentation. There’s also a good discussion of how you can set up single and multi-threaded debugging on the mod_wsgi Google Group.
You may also want to view the pydev documentation on remote debugging, which was used in writing this article.